
Sounds of Science: The Mystique of Sonification

 Welcome to the final installment of Hearing the UnHeard, Sounding Out!‘s series on what we don’t hear and how this unheard world affects us. The series started out with my post on hearing, large and small, continued with a piece by China Blue on the sounds of catastrophic impacts, and Milton Garcés’ piece on the infrasonic world of volcanoes. To cap it all off, we introduce The Sounds of Science by professor, cellist and interactive media expert, Margaret Schedel.
Dr. Schedel is an Associate Professor of Composition and Computer Music at Stony Brook University. Through her work, she explores the relatively new field of Data Sonification, generating new ways to perceive and interact with information through the use of sound. While everyone is familiar with informatics, graphs and images used to convey complex information, her work explores how we can expand our understanding of even complex scientific information by using our fastest and most emotionally compelling sense, hearing.
– Guest Editor Seth Horowitz
—
With the invention of digital sound, the number of scientific experiments using sound has skyrocketed in the 21st century, and as Sounding Out! readers know, sonification has started to enter the public consciousness as a new and refreshing alternative modality for exploring and understanding many kinds of datasets emerging from research into everything from deep space to the underground. We seem to be in a moment in which “science that sounds” has a special magic, a mystique that relies to some extent on misunderstandings in popular awareness about the processes and potentials of that alternative modality.
For one thing, using sound to understand scientific phenomena is not actually new. Diarist Samuel Pepys wrote about meeting scientist Robert Hooke in 1666 that “he is able to tell how many strokes a fly makes with her wings (those flies that hum in their flying) by the note that it answers to in musique during their flying.” Unfortunately Hooke never published his findings, leading researchers to speculate on his methods. One popular theory is that he tied strings of varying lengths between a fly and an ear trumpet, recognizing that sympathetic resonance would cause the correct length string to vibrate, thus allowing him to calculate the frequency. Even Galileo used sound, showing the constant acceleration of a ball due to gravity by using an inclined plane with thin moveable frets. By moving the placement of the frets until the clicks created an even tempo he was able to come up with a mathematical equation to describe how time and distance relate when an object falls.
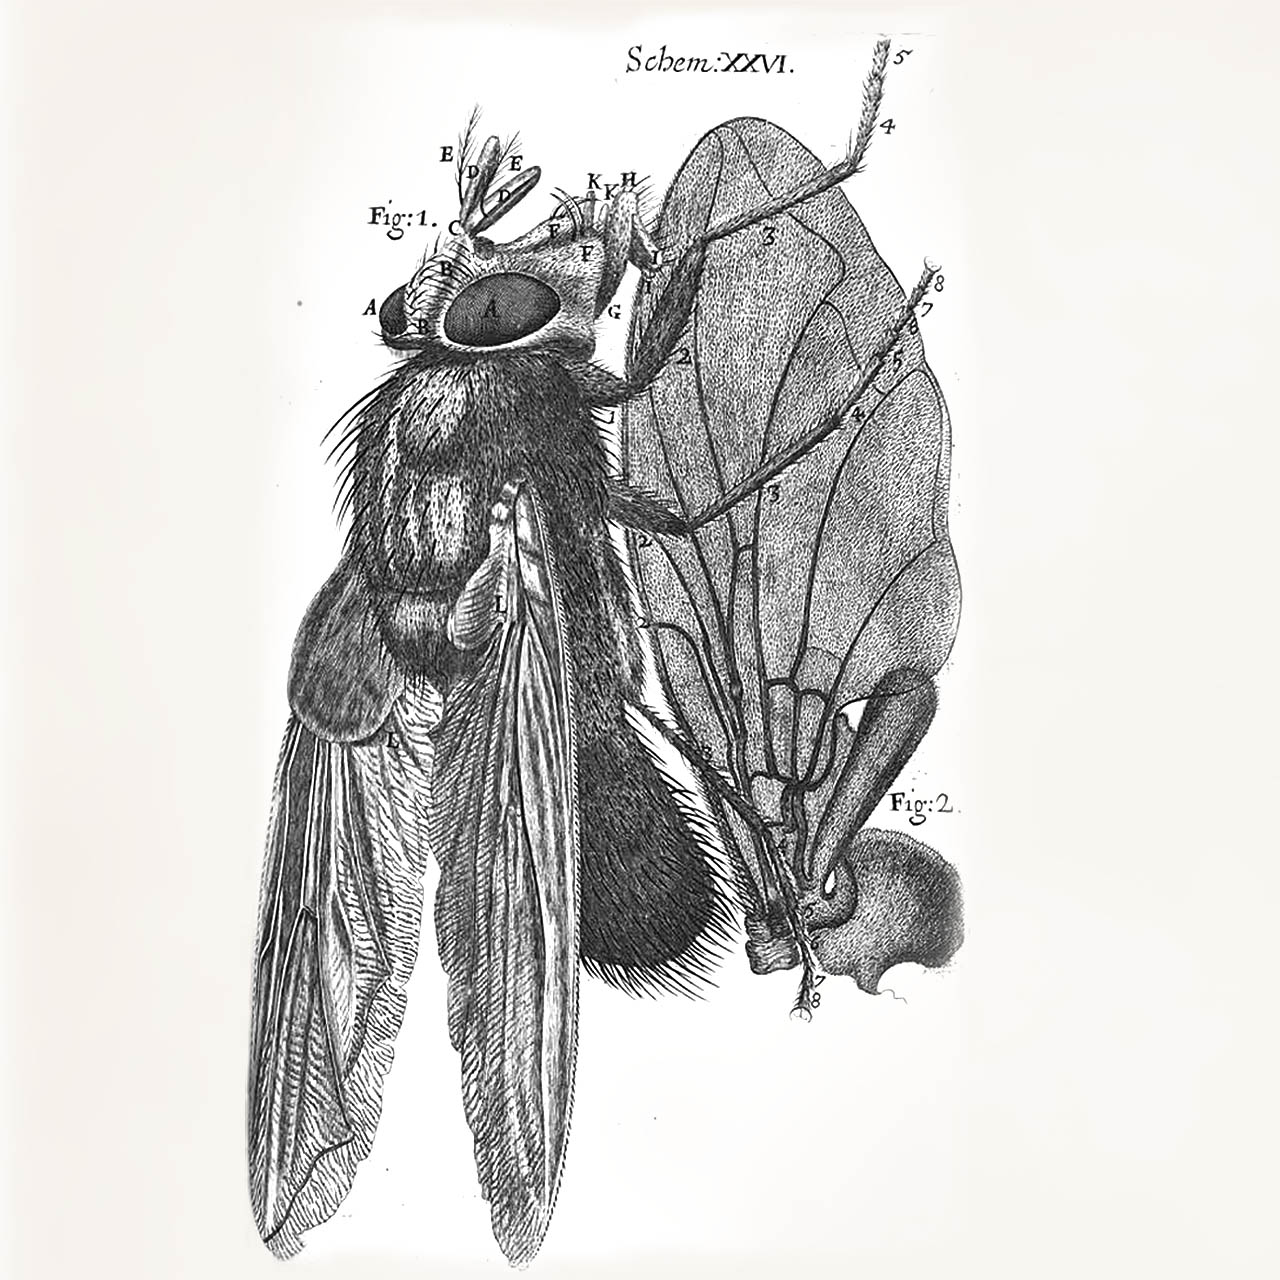
Illustration from Robert Hooke’s Micrographia (1665)
There have also been other scientific advances using sound in the more recent past. The stethoscope was invented in 1816 for auscultation, listening to the sounds of the body. It was later applied to machines—listening for the operation of the technological gear. Underwater sonar was patented in 1913 and is still used to navigate and communicate using hydroacoustic phenomenon. The Geiger Counter was developed in 1928 using principles discovered in 1908; it is unclear exactly when the distinctive sound was added. These are all examples of auditory display [AD]; sonification-generating or manipulating sound by using data is a subset of AD. As the forward to the The Sonification Handbook states, “[Since 1992] Technologies that support AD have matured. AD has been integrated into significant (read “funded” and “respectable”) research initiatives. Some forward thinking universities and research centers have established ongoing AD programs. And the great need to involve the entire human perceptual system in understanding complex data, monitoring processes, and providing effective interfaces has persisted and increased” (Thomas Hermann, Andy Hunt, John G. Neuhoff, Sonification Handbook, iii)
Sonification clearly enables scientists, musicians and the public to interact with data in a very different way, particularly compared to the more numerous techniques involving vision. Indeed, because hearing functions quite differently than vision, sonification offers an alternative kind of understanding of data (sometimes more accurate), which would not be possible using eyes alone. Hearing is multi-directional—our ears don’t have to be pointing at a sound source in order to sense it. Furthermore, the frequency response of our hearing is thousands of times more accurate than our vision. In order to reproduce a moving image the sampling rate (called frame-rate) for film is 24 frames per second, while audio has to be sampled at 44,100 frames per second in order to accurately reproduce sound. In addition, aural perception works on simultaneous time scales—we can take in multiple streams of audio data at once at many different dynamics, while our pupils dilate and contract, limiting how much visual data we can absorb at a single time. Our ears are also amazing at detecting regular patterns over time in data; we hear these patterns as frequency, harmonic relationships, and timbre.
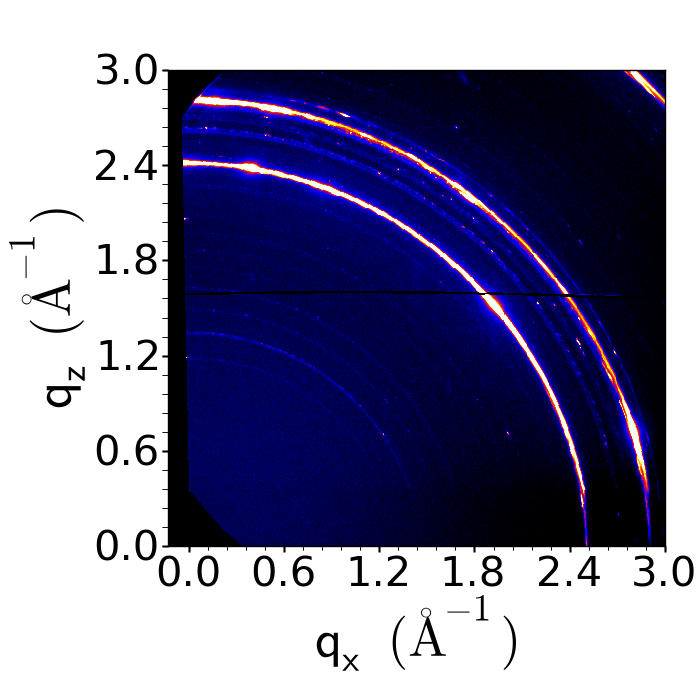
Image credit: Dr. Kevin Yager, Brookhaven National Lab.
But hearing isn’t simple, either. In the current fascination with sonification, the fact that aesthetic decisions must be made in order to translate data into the auditory domain can be obscured. Headlines such as “Here’s What the Higgs Boson Sounds Like” are much sexier than headlines such as “Here is What One Possible Mapping of Some of the Data We Have Collected from a Scientific Measuring Instrument (which itself has inaccuracies) Into Sound.” To illustrate the complexity of these aesthetic decisions, which are always interior to the sonification process, I focus here on how my collaborators and I have been using sound to understand many kinds of scientific data.
My husband, Kevin Yager, a staff scientist at Brookhaven National Laboratory, works at the Center for Functional Nanomaterials using scattering data from x-rays to probe the structure of matter. One night I asked him how exactly the science of x-ray scattering works. He explained that X-rays “scatter” off of all the atoms/particles in the sample and the intensity is measured by a detector. He can then calculate the structure of the material, using the Fast Fourier Transform (FFT) algorithm. He started to explain FFT to me, but I interrupted him because I use FFT all the time in computer music. The same algorithm he uses to determine the structure of matter, musicians use to separate frequency content from time. When I was researching this post, I found a site for computer music which actually discusses x-ray scattering as a precursor for FFT used in sonic applications.
To date, most sonifications have used data which changes over time – a fly’s wings flapping, a heartbeat, a radiation signature. Except in special cases Kevin’s data does not exist in time – it is a single snapshot. But because data from x-ray scattering is a Fourier Transform of the real-space density distribution, we could use additive synthesis, using multiple simultaneous sine waves, to represent different spatial modes. Using this method, we swept through his data radially, like a clock hand, making timbre-based sonifications from the data by synthesizing sine waves using with the loudness based on the intensity of the scattering data and frequency based on the position.
We played a lot with the settings of the additive synthesis, including the length of the sound, the highest frequency and even the number of frequency bins (going back to the clock metaphor – pretend the clock hand is a ruler – the number of frequency bins would be the number of demarcations on the ruler) arriving eventually at set of optimized variables.
Here is one version of the track we created using 10 frequency bins:
.
Here is one we created using 2000:
.
And here is one we created using 50 frequency bins, which we settled on:
.
On a software synthesizer this would be like the default setting. In the future we hope to have an interactive graphic user interface where sliders control these variables, just like a musician tweaks the sound of a synth, so scientists can bring out, or mask aspects of the data.
To hear what that would be like, here are a few tracks that vary length:
.
.
.
Finally, here is a track we created using different mappings of frequency and intensity:
.
Having these sliders would reinforce to the scientists that we are not creating “the sound of a metallic alloy,” we are creating one sonic representation of the data from the metallic alloy.
It is interesting that such a representation can be vital to scientists. At first, my husband went along with this sonification project as more of a thought experiment rather than something that he thought would actually be useful in the lab, until he heard something distinct about one of those sounds, suggesting that there was a misaligned sample. Once Kevin heard that glitched sound (you can hear it in the video above), he was convinced that sonification was a useful tool for his lab. He and his colleagues are dealing with measurements 1/25,000th the width of a human hair, aiming an X-ray through twenty pieces of equipment to get the beam focused just right. If any piece of equipment is out of kilter, the data can’t be collected. This is where our ears’ non-directionality is useful. The scientist can be working on his/her computer and, using ambient sound, know when a sample is misaligned.

It remains to be seen/heard if the sonifications will be useful to actually understand the material structures. We are currently running an experiment using Mechanical Turk to determine this kind of multi-modal display (using vision and audio) is actually helpful. Basically we are training people on just the images of the scattering data, and testing how well they do, and training another group of people on the images plus the sonification and testing how well they do.
I’m also working with collaborators at Stony Brook University on sonification of data. In one experiment we are using ambisonic (3-dimensional) sound to create a sonic map of the brain to understand drug addiction. Standing in the middle of the ambisonic cube, we hope to find relationships between voxels, a cube of brain tissue—analogous to pixels. When neurons fire in areas of the brain simultaneously there is most likely a causal relationship which can help scientists decode the brain activity of addiction. Computer vision researchers have been searching for these relationships unsuccessfully; we hope that our sonification will allow us to hear associations in distinct parts of the brain which are not easily recognized with sight. We are hoping to leverage the temporal pattern recognition of our auditory system, but we have been running into problems doing the sonification; each slice of data from the FMRI has about 300,000 data points. We have it working with 3,000 data points, but either our programming needs to get more efficient, or we have to get a much more powerful computer in order to work with all of the data.
On another project we are hoping to sonify gait data using smartphones. I’m working with some of my music students and a professor of Physical Therapy, Lisa Muratori, who works on understanding the underlying mechanisms of mobility problems in Parkinsons’ Disease (PD). The physical therapy lab has a digital motion-capture system and a split-belt treadmill for asymmetric stepping—the patients are supported by a harness so they don’t fall. PD is a progressive nervous system disorder characterized by slow movement, rigidity, tremor, and postural instability. Because of degeneration of specific areas of the brain, individuals with PD have difficulty using internally driven cues to initiate and drive movement. However, many studies have demonstrated an almost normal movement pattern when persons with PD are provided external cues, including significant improvements in gait with rhythmic auditory cueing. So far the research with PD and sound has be unidirectional – the patients listen to sound and try to match their gait to the external rhythms from the auditory cues.In our system we will use bio-feedback to sonify data from sensors the patients will wear and feed error messages back to the patient through music. Eventually we hope that patients will be able to adjust their gait by listening to self-generated musical distortions on a smartphone.
As sonification becomes more prevalent, it is important to understand that aesthetic decisions are inevitable and even essential in every kind of data representation. We are so accustomed to looking at visual representations of information—from maps to pie charts—that we may forget that these are also arbitrary transcodings. Even a photograph is not an unambiguous record of reality; the mechanics of the camera and artistic choices of the photographer control the representation. So too, in sonification, do we have considerable latitude. Rather than view these ambiguities as a nuisance, we should embrace them as a freedom that allows us to highlight salient features, or uncover previously invisible patterns.
__
Margaret Anne Schedel is a composer and cellist specializing in the creation and performance of ferociously interactive media. She holds a certificate in Deep Listening with Pauline Oliveros and has studied composition with Mara Helmuth, Cort Lippe and McGregor Boyle. She sits on the boards of 60×60 Dance, the BEAM Foundation, Devotion Gallery, the International Computer Music Association, and Organised Sound. She contributed a chapter to the Cambridge Companion to Electronic Music, and is a joint author of Electronic Music published by Cambridge University Press. She recently edited an issue of Organised Sound on sonification. Her research focuses on gesture in music, and the sustainability of technology in art. She ran SUNY’s first Coursera Massive Open Online Course (MOOC) in 2013. As an Associate Professor of Music at Stony Brook University, she serves as Co-Director of Computer Music and is a core faculty member of cDACT, the consortium for digital art, culture and technology.
—
Featured Image: Dr. Kevin Yager, data measured at X9 beamline, Brookhaven National Lab.
—
Research carried out at the Center for Functional Nanomaterials, Brookhaven National Laboratory, is supported by the U.S. Department of Energy, Office of Basic Energy Sciences, under Contract No. DE-AC02-98CH10886.
—
 REWIND! ….. If you liked this post, you might also like:
The Noises of Finance–N. Adriana Knouf
Revising the Future of Music Technology–Aaron Trammell
A Brief History of Auto-Tune–Owen Marshall
Share this:

Erratic Furnaces of Infrasound: Volcano Acoustics
Welcome back to Hearing the UnHeard, Sounding Out‘s series on how the unheard world affects us, which started out with my post on hearing large and small, continued with a piece by China Blue on the sounds of catastrophic impacts, and now continues with the deep sounds of the Earth itself by Earth Scientist Milton Garcés.
Faculty member at the University of Hawaii at Manoa and founder of the Earth Infrasound Laboratory in Kona, Hawaii, Milton Garces is an explorer of the infrasonic, sounds so low that they circumvent our ears but can be felt resonating through our bodies as they do through the Earth. Using global networks of specialized detectors, he explores the deepest sounds of our world from the depths of volcanic eruptions to the powerful forces driving tsunamis, to the trails left by meteors through our upper atmosphere. And while the raw power behind such events is overwhelming to those caught in them, his recordings let us appreciate the sense of awe felt by those who dare to immerse themselves.
In this installment of Hearing the UnHeard, Garcés takes us on an acoustic exploration of volcanoes, transforming what would seem a vision of the margins of hell to a near-poetic immersion within our planet.
– Guest Editor Seth Horowitz
—
The sun rose over the desolate lava landscape, a study of red on black. The night had been rich in aural diversity: pops, jetting, small earthquakes, all intimately felt as we camped just a mile away from the Pu’u O’o crater complex and lava tube system of Hawaii’s Kilauea Volcano.
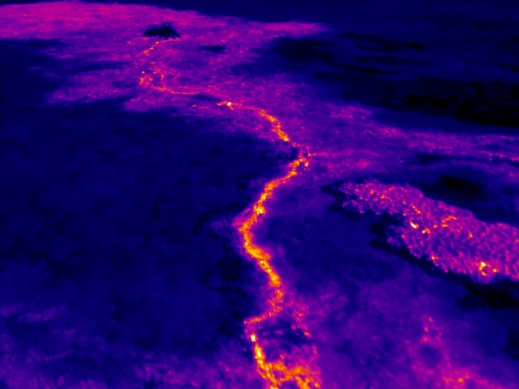
The sound records and infrared images captured over the night revealed a new feature downslope of the main crater. We donned our gas masks, climbed the mountain, and confirmed that indeed a new small vent had grown atop the lava tube, and was radiating throbbing bass sounds. We named our acoustic discovery the Uber vent. But, as most things volcanic, our find was transitory – the vent was eventually molten and recycled into the continuously changing landscape, as ephemeral as the sound that led us there in the first place.
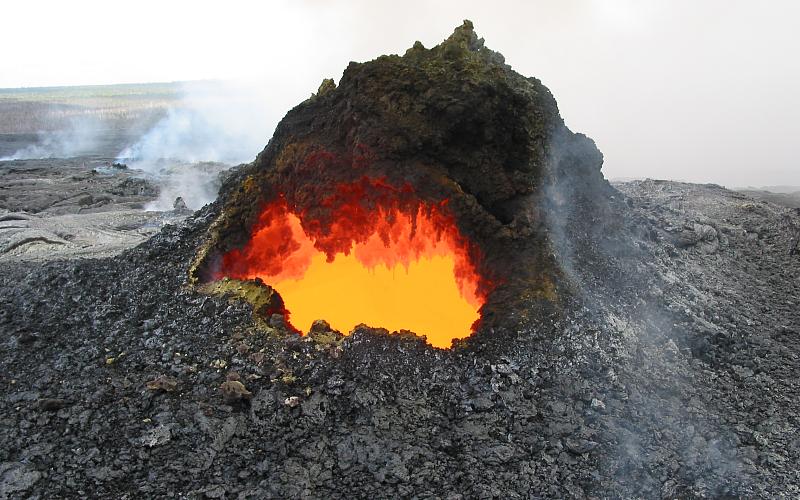
Volcanoes are exceedingly expressive mountains. When quiescent they are pretty and fertile, often coyly cloud-shrouded, sometimes snowcapped. When stirring, they glow, swell and tremble, strongly-scented, exciting, unnerving. And in their full fury, they are a menacing incandescent spectacle. Excess gas pressure in the magma drives all eruptive activity, but that activity varies. Kilauea volcano in Hawaii has primordial, fluid magmas that degass well, so violent explosive activity is not as prominent as in volcanoes that have more evolved, viscous material.
Well-degassed volcanoes pave their slopes with fresh lava, but they seldom kill in violence. In contrast, the more explosive volcanoes demolish everything around them, including themselves; seppuku by fire. Such massive, disruptive eruptions often produce atmospheric sounds known as infrasounds, an extreme basso profondo that can propagate for thousands of kilometers. Infrasounds are usually inaudible, as they reside below the 20 Hz threshold of human hearing and tonality. However, when intense enough, we can perceive infrasound as beats or sensations.
Like a large door slamming, the concussion of a volcanic explosion can be startling and terrifying. It immediately compels us to pay attention, and it’s not something one gets used to. The roaring is also disconcerting, especially if one thinks of a volcano as an erratic furnace with homicidal tendencies. But occasionally, amidst the chaos and cacophony, repeatable sound patterns emerge, suggestive of a modicum of order within the complex volcanic system. These reproducible, recognizable patterns permit the identification of early warning signals, and keep us listening.
Each of us now have technology within close reach to capture and distribute Nature’s silent warning signals, be they from volcanoes, tsunamis, meteors, or rogue nations testing nukes. Infrasounds, long hidden under the myth of silence, will be everywhere revealed.
The “Cookie Monster” skylight on the southwest flank of Pu`u `O`o. Photo by J. Kauahikaua 27 September 2002
I first heard these volcanic sounds in the rain forests of Costa Rica. As a graduate student, I was drawn to Arenal Volcano by its infamous reputation as one of the most reliably explosive volcanoes in the Americas. Arenal was cloud-covered and invisible, but its roar was audible and palpable. Here is a tremor (a sustained oscillation of the ground and atmosphere) recorded at Arenal Volcano in Costa Rica with a 1 Hz fundamental and its overtones:
.
In that first visit to Arenal, I tried to reconstruct in my minds’ eye what was going on at the vent from the diverse sounds emitted behind the cloud curtain. I thought I could blindly recognize rockfalls, blasts, pulsations, and ground vibrations, until the day the curtain lifted and I could confirm my aural reconstruction closely matched the visual scene. I had imagined a flashing arc from the shock wave as it compressed the steam plume, and by patient and careful observation I could see it, a rapid shimmer slashing through the vapor. The sound of rockfalls matched large glowing boulders bouncing down the volcano’s slope. But there were also some surprises. Some visible eruptions were slow, so I could not hear them above the ambient noise. By comparing my notes to the infrasound records I realized these eruption had left their deep acoustic mark, hidden in plain sight just below aural silence.

Arenal, Costa Rica, May 1, 2010. Image by Flickr user Daniel Vercelli.
I then realized one could chronicle an eruption through its sounds, and recognize different types of activity that could be used for early warning of hazardous eruptions even under poor visibility. At the time, I had only thought of the impact and potential hazard mitigation value to nearby communities. This was in 1992, when there were only a handful of people on Earth who knew or cared about infrasound technology. With the cessation of atmospheric nuclear tests in 1980 and the promise of constant vigilance by satellites, infrasound was deemed redundant and had faded to near obscurity over two decades. Since there was little interest, we had scarce funding, and were easily ignored. The rest of the volcano community considered us a bit eccentric and off the main research streams, but patiently tolerated us. However, discussions with my few colleagues in the US, Italy, France, and Japan were open, spirited, and full of potential. Although we didn’t know it at the time, we were about to live through Gandhi’s quote: “First they ignore you, then they laugh at you, then they fight you, then you win.”
Fast forward 22 years. A computer revolution took place in the mid-90’s. The global infrasound network of the International Monitoring System (IMS) began construction before the turn of the millennium, in its full 24-bit broadband digital glory. Designed by the United Nations’s Comprehensive Nuclear-Test-Ban Treaty Organization (CTBTO), the IMS infrasound detects minute pressure variations produced by clandestine nuclear tests at standoff distances of thousands of kilometers. This new, ultra-sensitive global sensor network and its cyberinfrastructure triggered an Infrasound Renaissance and opened new opportunities in the study and operational use of volcano infrasound.
Suddenly endowed with super sensitive high-resolution systems, fast computing, fresh capital, and the glorious purpose of global monitoring for hazardous explosive events, our community rapidly grew and reconstructed fundamental paradigms early in the century. The mid-naughts brought regional acoustic monitoring networks in the US, Europe, Southeast Asia, and South America, and helped validate infrasound as a robust monitoring technology for natural and man-made hazards. By 2010, infrasound was part of the accepted volcano monitoring toolkit. Today, large portions of the IMS infrasound network data, once exclusive, are publicly available (see links at the bottom), and the international infrasound community has grown to the hundreds, with rapid evolution as new generations of scientists joins in.
In order to capture infrasound, a microphone with a low frequency response or a barometer with a high frequency response are needed. The sensor data then needs to be digitized for subsequent analysis. In the pre-millenium era, you’d drop a few thousand dollars to get a single, basic data acquisition system. But, in the very near future, there’ll be an app for that. Once the sound is sampled, it looks much like your typical sound track, except you can’t hear it. A single sensor record is of limited use because it does not have enough information to unambiguously determine the arrival direction of a signal. So we use arrays and networks of sensors, using the time of flight of sound from one sensor to another to recognize the direction and speed of arrival of a signal. Once we associate a signal type to an event, we can start characterizing its signature.
Consider Kilauea Volcano. Although we think of it as one volcano, it actually consists of various crater complexes with a number of sounds. Here is the sound of a collapsing structure
As you might imagine, it is very hard to classify volcanic sounds. They are diverse, and often superposed on other competing sounds (often from wind or the ocean). As with human voices, each vent, volcano, and eruption type can have its own signature. Identifying transportable scaling relationships as well as constructing a clear notation and taxonomy for event identification and characterization remains one of the field’s greatest challenges. A 15-year collection of volcanic signals can be perused here, but here are a few selected examples to illustrate the problem.
First, the only complete acoustic record of the birth of Halemaumau’s vent at Kilauea, 19 March 2008:
.
Here is a bench collapse of lava near the shoreline, which usually leads to explosions as hot lava comes in contact with the ocean:
.
.
Here is one of my favorites, from Tungurahua Volcano, Ecuador, recorded by an array near the town of Riobamba 40 km away. Although not as violent as the eruptive activity that followed it later that year, this sped-up record shows the high degree of variability of eruption sounds:
.
The infrasound community has had an easier time when it comes to the biggest and meanest eruptions, the kind that can inject ash to cruising altitudes and bring down aircraft. Our Acoustic Surveillance for Hazardous Studies (ASHE) in Ecuador identified the acoustic signature of these type of eruptions. Here is one from Tungurahua:
.
Our data center crew was at work when such a signal scrolled through the monitoring screens, arriving first at Riobamba, then at our station near the Colombian border. It was large in amplitude and just kept on going, with super heavy bass – and very recognizable. Such signals resemble jet noise — if a jet was designed by giants with stone tools. These sustained hazardous eruptions radiate infrasound below 0.02 Hz (50 second periods), so deep in pitch that they can propagate for thousands of kilometers to permit robust acoustic detection and early warning of hazardous eruptions.
In collaborations with our colleagues at the Earth Observatory of Singapore (EOS) and the Republic of Palau, infrasound scientists will be turning our attention to early detection of hazardous volcanic eruptions in Southeast Asia. One of the primary obstacles to technology evolution in infrasound has been the exorbitant cost of infrasound sensors and data acquisition systems, sometimes compounded by export restrictions. However, as everyday objects are increasingly vested with sentience under the Internet of Things, this technological barrier is rapidly collapsing. Instead, the questions of the decade are how to receive, organize, and distribute the wealth of information under our perception of sound so as to construct a better informed and safer world.
IRIS Links
http://www.iris.edu/spud/infrasoundevent
http://www.iris.edu/bud_stuff/dmc/bud_monitor.ALL.html, search for IM and UH networks, infrasound channel name BDF
—
Milton Garcés is an Earth Scientist at the University of Hawaii at Manoa and the founder of the Infrasound Laboratory in Kona. He explores deep atmospheric sounds, or infrasounds, which are inaudible but may be palpable. Milton taps into a global sensor network that captures signals from intense volcanic eruptions, meteors, and tsunamis. His studies underscore our global connectedness and enhance our situational awareness of Earth’s dynamics. You are invited to follow him on Twitter @iSoundHunter for updates on things Infrasonic and to get the latest news on the Infrasound App.
—
Featured image: surface flows as seen by thermal cameras at Pu’u O’o crater, June 27th, 2014. Image: USGS
—
REWIND! If you liked this post, check out …
SO! Amplifies: Ian Rawes and the London Sound Survey — Ian Rawes
Sounding Out Podcast #14: Interview with Meme Librarian Amanda Brennan — Aaron Trammell
Catastrophic Listening — China Blue
Share this:


Current Top Posts


April 2021

January 2020
November 2019

October 2019

August 2019

April 2014

November 2017

March 2015
December 2017

October 2015

Recent Comments