 SO! Amplifies. . .a highly-curated, rolling mini-post series by which we editors hip you to cultural makers and organizations doing work we really really dig. You’re welcome!
.
—
The London Sound Survey website went online in 2009 with a couple of hundred recordings I’d made over the previous year. For a long time I’d wanted to make a website about London but couldn’t think of a good angle. When I got a job as a storeman in the British Library’s sound archive I became interested in field recording. There were the chance discoveries in the crates I hauled around of LPs like Murray Schafer’s The Vancouver Soundscape and the Time of Bells series by the anthropologist Steven Feld. I realised that sound could be the way to know my home city better and to present my experience of it.
Fast forward to last week: It is a warm June afternoon and the marsh is alive with the hum of the Waltham Cross electricity substation. I am a few miles to the northeast of London in the shallow crease of the Lea Valley. It’s a part of the extra-urban mosaic of reservoirs, quarries, industrial brownfield sites, grazing lands, nature reserves and outdoor leisure centres which has been usefully named “Edgelands” by the environmentalist Marion Shoard.
.
To make the recording, I’m wearing two mics strapped to each side of my head. The grey acrylic fur windcovers enveloping each mic might, from a distance, look like small woodland animals. It’s as well that not many people come here.
This is how I’m spending the summer, gathering the raw material for a new section on the
London Sound Survey website. The
London Sound Survey is a growing collection of Creative Commons-licensed sound recordings of places, events and wildlife in the British capital. Historical references too are gathered to find out how London’s sounds have changed. It’s partly to experiment with depicting the sounds of places as diagrams and collages rather than literal-minded maps. But it’s also a nice indulgence after quitting a job where I spent the last three years in a windowless room.
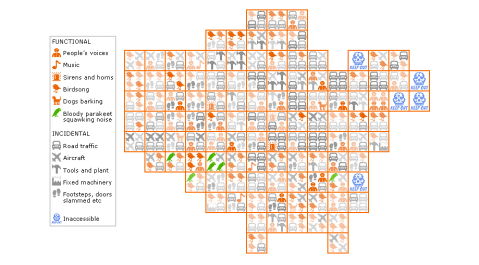
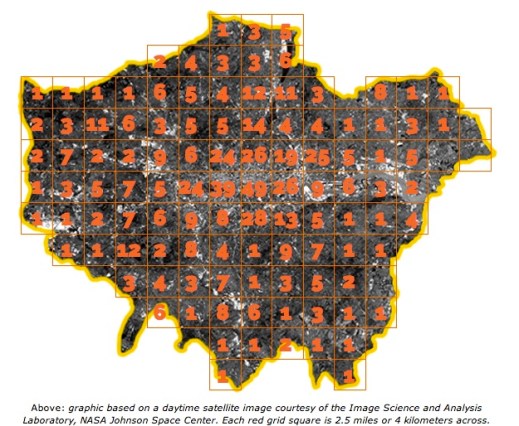
Content of the daytime sound grid recordings depicted in graphical form. The louder the sound, the darker the icon. More than one icon of the same kind means that sound takes up more of the recording. The London Sound Survey® 2014
Listening as a topic of scholarly interest has grown in popularity recently. I was interested too, and thought the best way forward was to find some expert listeners – blind people – and ask for their opinions. I soon learned there were differences in perceptions between those born blind, and those with age-related visual impairments. The former are more likely to have detailed mental maps of their surroundings based on listening to reverberation, from which they learn about features like the width of streets and the height of buildings.
.
I’m grateful to have
Andre Louis, a blind musician and field recordist, begin to add his recordings and commentary to the
LSS website. I’m always struck by the precision with which Andre pays attention to what he hears around him.
.

Hear the city’s busy thoroughfares and quieter corners through the ears of musician and recordist Andre Louis. His thoughts on why he records are rendered in braille to form the basis for a new London sound map. The London Sound Survey® 2014
Other work is to be done. The
Museum of London has offered to archive the site’s recordings and I have to ferret out all the original uncompressed sound files for them. Also, new batches of recordings have to be made for another site project, the
12 Tones of London. Here I’ve used census data and a statistical method called cluster analysis to sort neighbourhoods into 12 groups, and identify in each group the most demographically ‘typical’ neighbourhood to record in.
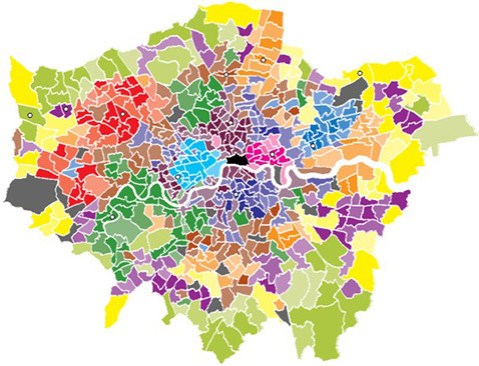
12 Tones of London uses a statistical analysis to select 12 out of London’s 623 council wards (not counting the City of London) in the hope that their sound profiles can be generalised across relatively large swathes of the capital. The London Sound Survey® 2014
This way, the primary social facts of class and ethnicity are put into the foreground of the project by determining where recordings are made. It’s a small start in moving away from the tropes of unusual or disappearing sounds, and towards how new ways of living sound in a city reproducing itself through great flows of capital and labour.
.
The London Sound Survey belongs to the tradition of enthusiasts’ websites which strive to amass as much information as they can about their chosen subjects. It has an open-ended design since the boundaries of what can be learned about city life and history through sound have hardly been tested, far less determined. It’s probably benefited from how the internet has expanded people’s access to music and other media, and from that a greater willingness to experiment in what they choose to listen to.
—
Ian Rawes was born in 1965 and grew up in London where he’s spent most of his life. Since leaving school he’s worked as a printer, book designer, market stallholder, concert promoter and sound archivist. He now runs the London Sound Survey full-time and lives in a suburb of south-east London.
—
REWIND!…If you liked this post, you may also dig:
.
.
.


I absolutely love that this is part of the process: “This way, the primary social facts of class and ethnicity are put into the foreground of the project by determining where recordings are made. It’s a small start in moving away from the tropes of unusual or disappearing sounds, and towards how new ways of living sound in a city reproducing itself through great flows of capital and labour.”
LikeLike