Sounds of Science: The Mystique of Sonification

 Welcome to the final installment of Hearing the UnHeard, Sounding Out!‘s series on what we don’t hear and how this unheard world affects us. The series started out with my post on hearing, large and small, continued with a piece by China Blue on the sounds of catastrophic impacts, and Milton Garcés’ piece on the infrasonic world of volcanoes. To cap it all off, we introduce The Sounds of Science by professor, cellist and interactive media expert, Margaret Schedel.
Dr. Schedel is an Associate Professor of Composition and Computer Music at Stony Brook University. Through her work, she explores the relatively new field of Data Sonification, generating new ways to perceive and interact with information through the use of sound. While everyone is familiar with informatics, graphs and images used to convey complex information, her work explores how we can expand our understanding of even complex scientific information by using our fastest and most emotionally compelling sense, hearing.
– Guest Editor Seth Horowitz
—
With the invention of digital sound, the number of scientific experiments using sound has skyrocketed in the 21st century, and as Sounding Out! readers know, sonification has started to enter the public consciousness as a new and refreshing alternative modality for exploring and understanding many kinds of datasets emerging from research into everything from deep space to the underground. We seem to be in a moment in which “science that sounds” has a special magic, a mystique that relies to some extent on misunderstandings in popular awareness about the processes and potentials of that alternative modality.
For one thing, using sound to understand scientific phenomena is not actually new. Diarist Samuel Pepys wrote about meeting scientist Robert Hooke in 1666 that “he is able to tell how many strokes a fly makes with her wings (those flies that hum in their flying) by the note that it answers to in musique during their flying.” Unfortunately Hooke never published his findings, leading researchers to speculate on his methods. One popular theory is that he tied strings of varying lengths between a fly and an ear trumpet, recognizing that sympathetic resonance would cause the correct length string to vibrate, thus allowing him to calculate the frequency. Even Galileo used sound, showing the constant acceleration of a ball due to gravity by using an inclined plane with thin moveable frets. By moving the placement of the frets until the clicks created an even tempo he was able to come up with a mathematical equation to describe how time and distance relate when an object falls.
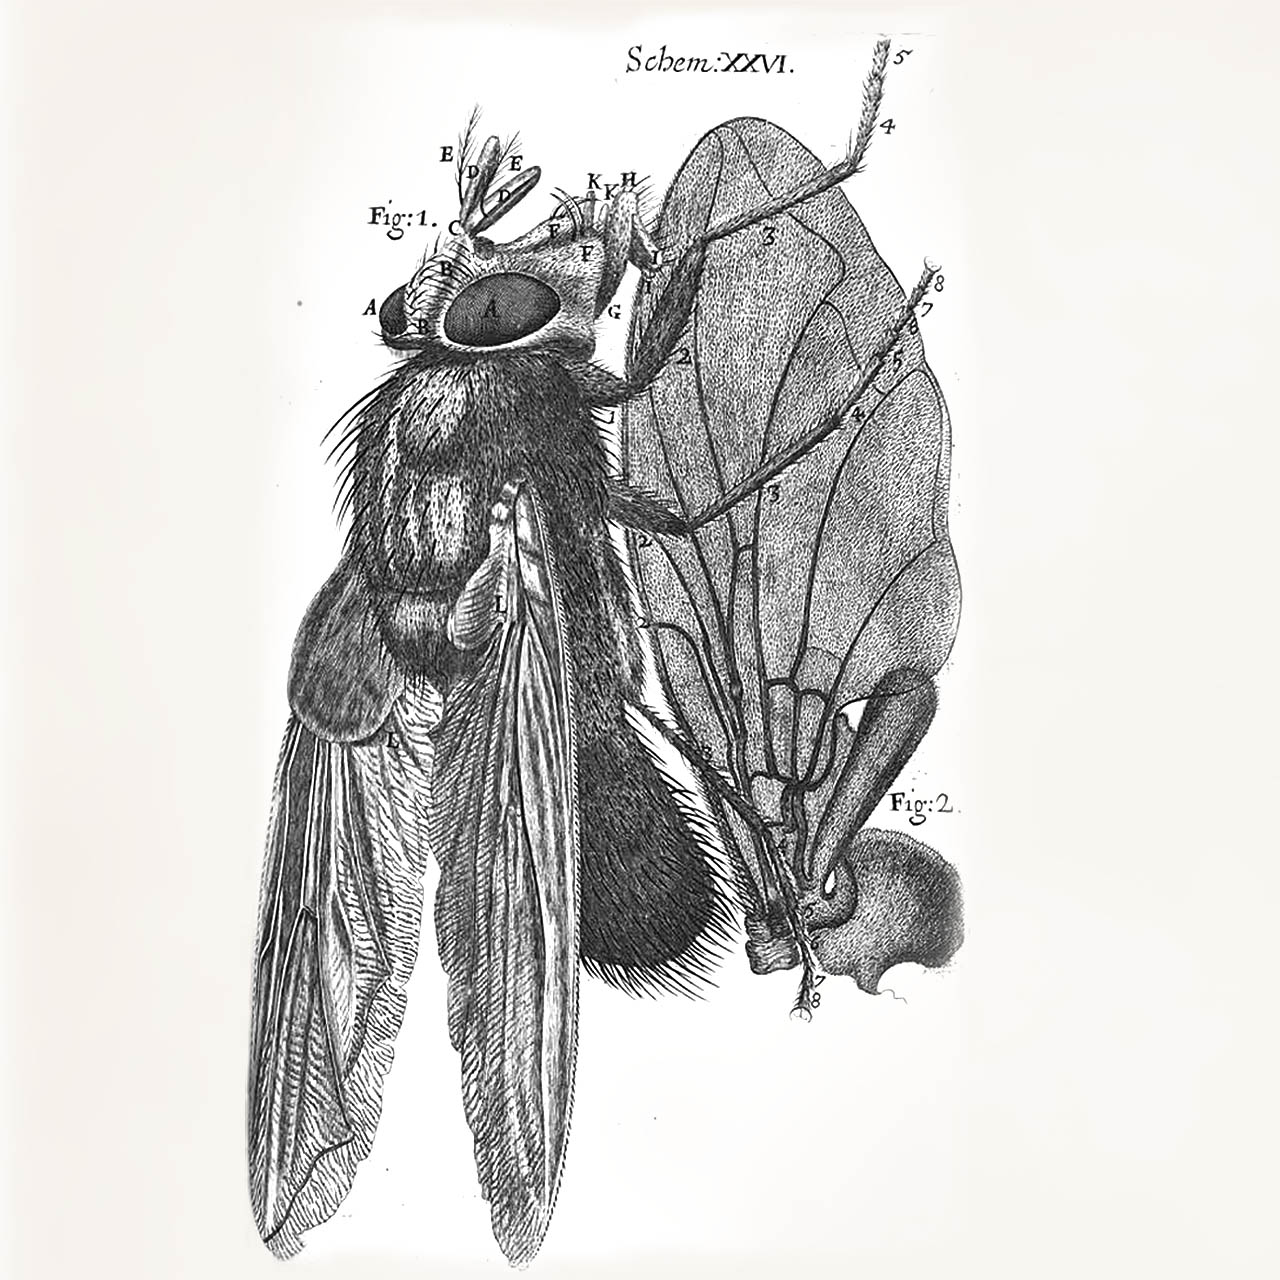
Illustration from Robert Hooke’s Micrographia (1665)
There have also been other scientific advances using sound in the more recent past. The stethoscope was invented in 1816 for auscultation, listening to the sounds of the body. It was later applied to machines—listening for the operation of the technological gear. Underwater sonar was patented in 1913 and is still used to navigate and communicate using hydroacoustic phenomenon. The Geiger Counter was developed in 1928 using principles discovered in 1908; it is unclear exactly when the distinctive sound was added. These are all examples of auditory display [AD]; sonification-generating or manipulating sound by using data is a subset of AD. As the forward to the The Sonification Handbook states, “[Since 1992] Technologies that support AD have matured. AD has been integrated into significant (read “funded” and “respectable”) research initiatives. Some forward thinking universities and research centers have established ongoing AD programs. And the great need to involve the entire human perceptual system in understanding complex data, monitoring processes, and providing effective interfaces has persisted and increased” (Thomas Hermann, Andy Hunt, John G. Neuhoff, Sonification Handbook, iii)
Sonification clearly enables scientists, musicians and the public to interact with data in a very different way, particularly compared to the more numerous techniques involving vision. Indeed, because hearing functions quite differently than vision, sonification offers an alternative kind of understanding of data (sometimes more accurate), which would not be possible using eyes alone. Hearing is multi-directional—our ears don’t have to be pointing at a sound source in order to sense it. Furthermore, the frequency response of our hearing is thousands of times more accurate than our vision. In order to reproduce a moving image the sampling rate (called frame-rate) for film is 24 frames per second, while audio has to be sampled at 44,100 frames per second in order to accurately reproduce sound. In addition, aural perception works on simultaneous time scales—we can take in multiple streams of audio data at once at many different dynamics, while our pupils dilate and contract, limiting how much visual data we can absorb at a single time. Our ears are also amazing at detecting regular patterns over time in data; we hear these patterns as frequency, harmonic relationships, and timbre.
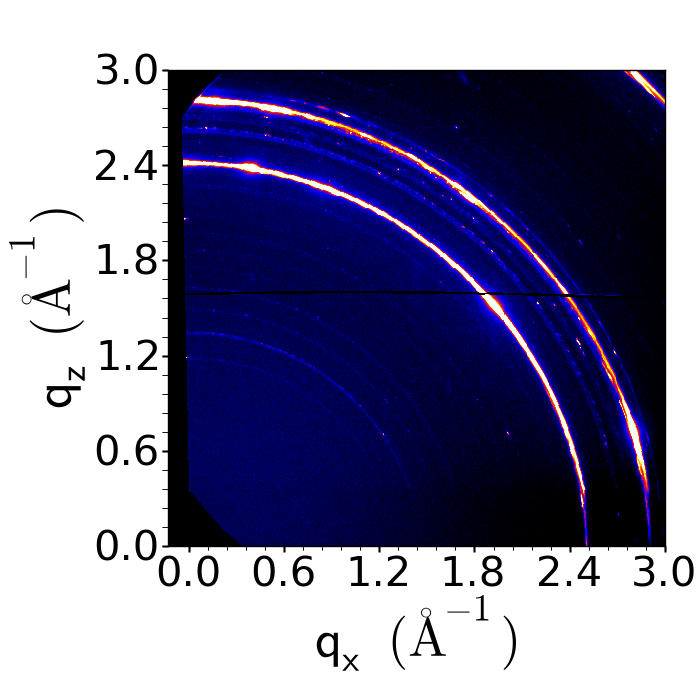
Image credit: Dr. Kevin Yager, Brookhaven National Lab.
But hearing isn’t simple, either. In the current fascination with sonification, the fact that aesthetic decisions must be made in order to translate data into the auditory domain can be obscured. Headlines such as “Here’s What the Higgs Boson Sounds Like” are much sexier than headlines such as “Here is What One Possible Mapping of Some of the Data We Have Collected from a Scientific Measuring Instrument (which itself has inaccuracies) Into Sound.” To illustrate the complexity of these aesthetic decisions, which are always interior to the sonification process, I focus here on how my collaborators and I have been using sound to understand many kinds of scientific data.
My husband, Kevin Yager, a staff scientist at Brookhaven National Laboratory, works at the Center for Functional Nanomaterials using scattering data from x-rays to probe the structure of matter. One night I asked him how exactly the science of x-ray scattering works. He explained that X-rays “scatter” off of all the atoms/particles in the sample and the intensity is measured by a detector. He can then calculate the structure of the material, using the Fast Fourier Transform (FFT) algorithm. He started to explain FFT to me, but I interrupted him because I use FFT all the time in computer music. The same algorithm he uses to determine the structure of matter, musicians use to separate frequency content from time. When I was researching this post, I found a site for computer music which actually discusses x-ray scattering as a precursor for FFT used in sonic applications.
To date, most sonifications have used data which changes over time – a fly’s wings flapping, a heartbeat, a radiation signature. Except in special cases Kevin’s data does not exist in time – it is a single snapshot. But because data from x-ray scattering is a Fourier Transform of the real-space density distribution, we could use additive synthesis, using multiple simultaneous sine waves, to represent different spatial modes. Using this method, we swept through his data radially, like a clock hand, making timbre-based sonifications from the data by synthesizing sine waves using with the loudness based on the intensity of the scattering data and frequency based on the position.
We played a lot with the settings of the additive synthesis, including the length of the sound, the highest frequency and even the number of frequency bins (going back to the clock metaphor – pretend the clock hand is a ruler – the number of frequency bins would be the number of demarcations on the ruler) arriving eventually at set of optimized variables.
Here is one version of the track we created using 10 frequency bins:
.
Here is one we created using 2000:
.
And here is one we created using 50 frequency bins, which we settled on:
.
On a software synthesizer this would be like the default setting. In the future we hope to have an interactive graphic user interface where sliders control these variables, just like a musician tweaks the sound of a synth, so scientists can bring out, or mask aspects of the data.
To hear what that would be like, here are a few tracks that vary length:
.
.
.
Finally, here is a track we created using different mappings of frequency and intensity:
.
Having these sliders would reinforce to the scientists that we are not creating “the sound of a metallic alloy,” we are creating one sonic representation of the data from the metallic alloy.
It is interesting that such a representation can be vital to scientists. At first, my husband went along with this sonification project as more of a thought experiment rather than something that he thought would actually be useful in the lab, until he heard something distinct about one of those sounds, suggesting that there was a misaligned sample. Once Kevin heard that glitched sound (you can hear it in the video above), he was convinced that sonification was a useful tool for his lab. He and his colleagues are dealing with measurements 1/25,000th the width of a human hair, aiming an X-ray through twenty pieces of equipment to get the beam focused just right. If any piece of equipment is out of kilter, the data can’t be collected. This is where our ears’ non-directionality is useful. The scientist can be working on his/her computer and, using ambient sound, know when a sample is misaligned.

It remains to be seen/heard if the sonifications will be useful to actually understand the material structures. We are currently running an experiment using Mechanical Turk to determine this kind of multi-modal display (using vision and audio) is actually helpful. Basically we are training people on just the images of the scattering data, and testing how well they do, and training another group of people on the images plus the sonification and testing how well they do.
I’m also working with collaborators at Stony Brook University on sonification of data. In one experiment we are using ambisonic (3-dimensional) sound to create a sonic map of the brain to understand drug addiction. Standing in the middle of the ambisonic cube, we hope to find relationships between voxels, a cube of brain tissue—analogous to pixels. When neurons fire in areas of the brain simultaneously there is most likely a causal relationship which can help scientists decode the brain activity of addiction. Computer vision researchers have been searching for these relationships unsuccessfully; we hope that our sonification will allow us to hear associations in distinct parts of the brain which are not easily recognized with sight. We are hoping to leverage the temporal pattern recognition of our auditory system, but we have been running into problems doing the sonification; each slice of data from the FMRI has about 300,000 data points. We have it working with 3,000 data points, but either our programming needs to get more efficient, or we have to get a much more powerful computer in order to work with all of the data.
On another project we are hoping to sonify gait data using smartphones. I’m working with some of my music students and a professor of Physical Therapy, Lisa Muratori, who works on understanding the underlying mechanisms of mobility problems in Parkinsons’ Disease (PD). The physical therapy lab has a digital motion-capture system and a split-belt treadmill for asymmetric stepping—the patients are supported by a harness so they don’t fall. PD is a progressive nervous system disorder characterized by slow movement, rigidity, tremor, and postural instability. Because of degeneration of specific areas of the brain, individuals with PD have difficulty using internally driven cues to initiate and drive movement. However, many studies have demonstrated an almost normal movement pattern when persons with PD are provided external cues, including significant improvements in gait with rhythmic auditory cueing. So far the research with PD and sound has be unidirectional – the patients listen to sound and try to match their gait to the external rhythms from the auditory cues.In our system we will use bio-feedback to sonify data from sensors the patients will wear and feed error messages back to the patient through music. Eventually we hope that patients will be able to adjust their gait by listening to self-generated musical distortions on a smartphone.
As sonification becomes more prevalent, it is important to understand that aesthetic decisions are inevitable and even essential in every kind of data representation. We are so accustomed to looking at visual representations of information—from maps to pie charts—that we may forget that these are also arbitrary transcodings. Even a photograph is not an unambiguous record of reality; the mechanics of the camera and artistic choices of the photographer control the representation. So too, in sonification, do we have considerable latitude. Rather than view these ambiguities as a nuisance, we should embrace them as a freedom that allows us to highlight salient features, or uncover previously invisible patterns.
__
Margaret Anne Schedel is a composer and cellist specializing in the creation and performance of ferociously interactive media. She holds a certificate in Deep Listening with Pauline Oliveros and has studied composition with Mara Helmuth, Cort Lippe and McGregor Boyle. She sits on the boards of 60×60 Dance, the BEAM Foundation, Devotion Gallery, the International Computer Music Association, and Organised Sound. She contributed a chapter to the Cambridge Companion to Electronic Music, and is a joint author of Electronic Music published by Cambridge University Press. She recently edited an issue of Organised Sound on sonification. Her research focuses on gesture in music, and the sustainability of technology in art. She ran SUNY’s first Coursera Massive Open Online Course (MOOC) in 2013. As an Associate Professor of Music at Stony Brook University, she serves as Co-Director of Computer Music and is a core faculty member of cDACT, the consortium for digital art, culture and technology.
—
Featured Image: Dr. Kevin Yager, data measured at X9 beamline, Brookhaven National Lab.
—
Research carried out at the Center for Functional Nanomaterials, Brookhaven National Laboratory, is supported by the U.S. Department of Energy, Office of Basic Energy Sciences, under Contract No. DE-AC02-98CH10886.
—
 REWIND! ….. If you liked this post, you might also like:
The Noises of Finance–N. Adriana Knouf
Revising the Future of Music Technology–Aaron Trammell
A Brief History of Auto-Tune–Owen Marshall
Share this:

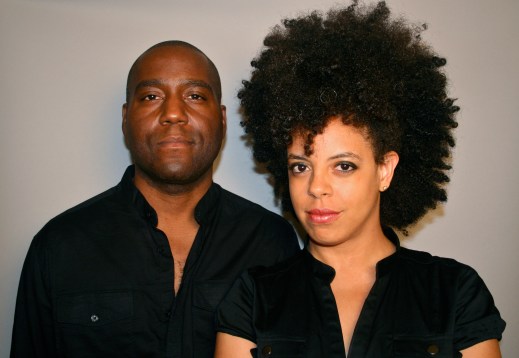
SO! Amplifies: Mendi+Keith Obadike and Sounding Race in America
 SO! Amplifies. . .a highly-curated, rolling mini-post series by which we editors hip you to cultural makers and organizations doing work we really really dig. You’re welcome!
—
Several years ago—after working on media art, myths, songs about invisible networks and imaginary places—we started a series of sound art projects about America. In making these public sound artworks about our country we ask ourselves questions about funk, austerity, debt and responsibility, aesthetics, and inheritance. We also attempt to reckon with data, that which orders so much of our lives with its presence or absence.
We are interested in how data might be understood differently once sonified or made musical. We want to explore what kinds of codes are embedded in the architecture of American culture.
Big House/Disclosure
The first sound art project in this vein that we completed in 2007 was entitled Big House / Disclosure. Northwestern University commissioned Big House / Disclosure to commemorate the 200th anniversary of the abolition of the British slave trade. We began researching Chicago’s recently (2002) issued Slavery Era Disclosure Ordinance, which states that any business seeking a city contract must publicly disclose (without penalty) its historical relationship, if any, to the slave trade. In that project we interviewed 200 citizens in the Chicago area about that city ordinance, how they (or their ancestors) arrived in this country, the origins of house music, and imaginary plantations, as well as their opinions about the legacy of slavery in their lives. Their answers were woven into a 200 hour house song & public sound installation on the Northwestern campus.
We used custom built software to trigger changes in the sound (drums, bass lines, chords, etc.) of that installation as the stock prices of companies like Lehman Brothers and Wachovia Bank (listed by this city ordinance as having profited from slave trade) rose and fell in 2007. In addition to the sound installation there were a number of performance scores and graphic scores to be performed in the project. The graphic scores were performed at the Stone (John Zorn’s music venue) by bassist Melvin Gibbs, turntablist Val Inc, percussionist Satoshi Takeshi, and pianist Shoko Nagai in New York. The book and album for this project (recorded with percussionist Guillermo Brown, cornetist Taylor Ho Bynum, cellist Okkyung Lee and percussionist Tim Feeney) were released by 1913 Press.
American Cypher

In 2012-13 we created American Cypher. This project looked at American stories about race and DNA. The stories included narratives about Barack Obama, geneticist James Watson, Oprah Winfrey, and two men in the criminal justice system. At the center of the project was a multi-channel sound installation made from a small 18th century bell that belonged to Sally Hemings (a woman enslaved by Thomas Jefferson and, as indicated by DNA testing, mother to his children). The bell was recorded and altered. It was tuned using DNA information (microsatellite STR analysis) from the Jefferson and Hemings families. That analysis gave us a pitch set that was used to compose the piece. The project was commissioned by Bucknell University’s Samek Gallery and Griot Institute. The exhibition was mounted at the Studio Museum in Harlem and later traveled to the Institute of Visual Art at the University of Milwaukee Wisconsin.
<p><a href=”http://vimeo.com/81574324″>Mendi + Keith Obadike: American Cypher – Samek Gallery and The Studio Museum in Harlem</a> from <a href=”http://vimeo.com/user12307441″>Keith Obadike</a> on <a href=”https://vimeo.com”>Vimeo</a>.</p>Free/Phase

Free/Phase is our latest project for 2014-15. This work uses the archives of Columbia College’s Center for Black Music Research (Chicago, Illinois) as its foundation. With this work we are doing conceptual remixes of African-American freedom songs found in the archives. We are thinking about how this music has been used over the past couple of centuries and all that is encoded in these songs musically, politically, and spiritually. There are three nodes to this project. These nodes will be presented and produced in several venues throughout the city of Chicago and will include audience participation.
1) Beacon
“Beacon” is made up of a distributed site-specific sound installation that “rings” morning, noon, and evening, playing a short melodic phrase from specific spirituals found in the CBMR archives. Each spiritual chosen contains musical & lyrical messages that could have been used for pre-emancipation navigation on the underground railroad or inspiration.
2) Overcome
“Overcome” is a video work that is inspired by ways that music was used during the American Civil Rights Movement.
3) Dialogue
“Dialogue” is comprised of “listening posts” throughout Chicago. A number of DJs engage audiences in a discussion about the canon of African-American freedom songs.
***
Across this series, we hope to invite new ways of thinking about the archives that hold information about our existence—the records of profit during the era of American slavery, the relationships marked in our genetic information, and the strategies for survival encoded in our music. Our work in this area reflects on the information that sometimes vanishes from view, whether because it is ephemeral or because it has been buried. We hope our sounding the archives invite new ways of listening to the past and the future at the same time.
—
Mendi + Keith Obadike make music, art and literature. Their works include The Sour Thunder, an Internet opera (Bridge Records), Crosstalk: American Speech Music (Bridge Records), Black.Net.Art Actions, a suite of new media artworks (published in re:skin on M.I.T Press), Big House / Disclosure, a 200 hour public sound installation (Northwestern University), Phonotype, a book & CD of media artworks, and a poetry collection, Armor and Flesh (Lotus Press). They have contributed sounds/music to projects by wide range of artists including loops for soul singer D’Angelo’s first album and a score for playwright Anna Deavere Smith at the Lincoln Center Institute. You can find out more about them at http://obadike.com.
—
Featured image from authors’ website.
—
 REWIND!…If you liked this post, you may also dig:
Wayback Sound Machine: Sound Through Time, Space, and Place-Maile Colbert
SO! Amplifies: Regina Bradley’s Outkasted Conversations-Regina Bradley
Or Does it Explode?: Sounding Out the U.S. Metropolis in Hansberry’s A Raisin in the Sun-Liana Silva-Ford
Share this:


Current Top Posts


April 2021
January 2020
November 2019

October 2019

August 2019

April 2014

November 2017
March 2015
December 2017

October 2015

Recent Comments