
(Sound)Walking Through Smithfield Square in Dublin

 Editor’s Note: This month Sounding Out! is thrilled to bring you a collection of posts that will change the way you hear cities. The Sounds of the City series will prompt readers to think through ideas about urban space and sound. Are cities as noisy as we think they are? Why are cities described as “loud”? Who makes these decisions about nomenclature and why?
We kicked things off last week with my critical reading of sound in Lorraine Hansberry’s A Raisin in the Sun, a play about African Americans in Chicago that still rings/stings true today. Regular writer Regina Bradley will discuss the dichotomy of urban and suburban in the context of sound (noisy versus quiet, respectively), and CFP winner Lilian Radovac will share with us a photoessay on the sound installation Megaphóne in Montreal. Today, guest writer Linda O’ Keeffe takes readers on a soundwalk of Smithfield Square in Dublin, Ireland and specifically of the Smithfield Horse Fair, in order to illustrate how urban renewal disrupts city soundscapes and how sound reclaims those spaces.–Managing Editor Liana M. Silva-Ford
—
Since 2010, as part of my PhD research, I have conducted over two dozen sound walks through the Smithfield Square and its environs, in Dublin’s North Inner city; with teenagers, by myself and through organising deep listening group walks as part of World Listening Day. These walks were designed to encourage the participating walkers to listen intently to this space and compare it to other spaces on the north side of Dublin city. The walks were also designed to examine the changing use and design of the Smithfield space over the past four years. This essay is drawn from the findings of this research, which explored the co-production of space and soundscapes with 84 teenagers (43 girls and 41 boys) from Dublin, Ireland. I include some of their observations of Smithfield Square here.
The Smithfield Square’s redesign began in 1996 as part of an urban regeneration project, and was completed in May of 2013. Smithfield is a traditional working class area, historically connected to wholesale markets, and in recent years it has gone through many iterations. In a push towards gentrification, the Smithfield Square space was ripped up, rebuilt, re-imagined and ripped up again because each iteration of its design proved unattractive to potential visitors/users of this space. According to the Royal Institute of the Architects of Ireland (1991), Dublin City Council considered these users were tourists and new middle class urbanites, not the locals.
Large-scale apartment complexes with business premises on the ground floor, tourist facilities, and an art house cinema were situated alongside smaller, older social housing, flat complexes and wholesale markets within the area. This reshaping of architecture impacts the diffusion of sound in space. It changes what Brandon LaBelle (2010) calls the acoustic territories that demarcate space where sound is no longer attributable to specific spaces or communities. Additionally, since the early 1990s, sounds within Smithfield began to change with the removal or downsizing of certain productive practices, such as the fish and fruit markets. This reduced the kind of traffic, both pedestrian and commercial, which would have moved and sounded through the area. The Smithfield Horse Fair disrupts the area’s soundscape and opens up the possibilities of the space of Smithfield Square for the broader community.
The design of the square, its restaurants, boutique shops and cafes, suggest that the soundscape designed for this space was meant to be a quiet and calm, recreating in the square what Karin Bijsterveld has defined in Mechanical Sound (2008) as the quiet of the middle classes. The sounds produced by the fair are then seen as counter to the types of sensory experiences that, Monica Montserrat Degen argues in her book Sensing Cities: Regenerating Public Life in Barcelona and Manchester (2008), are acceptable to the middle classes, who purchase a type of sensory/sonic experience. However, the soundwalks I describe contest what “quiet” means in the context of the square.
Listening to the Square
The Smithfield square in 2009. All pictures in this post come courtesy of the author, who holds the rights.

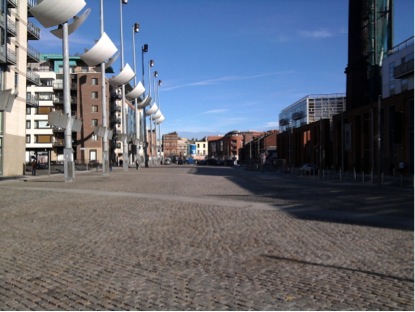
The Smithfield Square in 2009
In 2009 the Smithfield Square, which is laid with thousands of cobblestones, had placed around one side twelve 26.5 metre gas lighting masts, at one end of the square two lines of trees were planted with seating placed among them, and at the other end some large concrete plant pots. The seating located within the trees, attracted groups of homeless people and addicts. As a result, the dominant soundscape during the day was the sounds of men and women shouting obscenities at each other, with the susurration of trees rarely heard over this dominant sound. One of my teenage participants noted, “you always hear people screaming in the background” (Participant 2).

The Smithfield square in 2009
Aside from the shouting voices and loud reflections from singular sound sources within the Square such as the clatter of suitcase wheels across the cobblestones, seagulls screeching overhead, the beeping of trucks reversing and even the sounds of people talking at a distance, the teenagers who participated in the soundwalks defined the space as silent. Their use of the word silent did not mean the absence of sound, but rather an absence of activities, life, general sounds of community, consumption and production.
One sound that dominates the soundscape of Smithfield and its surroundings is the sound of the Luas tramline. The Luas line sits at one end of the Square and the sounds produced are distinctive: there is the whoosh as it passes, the ding a ling of its bells and the sounds of the doors opening and closing. The sound of the Luas echoes around the area from 6 in the morning till midnight. The sounds have become synonymous with that part of the city. The teenage participants defined these sounds as rhythmic, musical, “like a ballet.” For the teenager participants, the sounds of the Luas has been the only constant sound within Smithfield.

Public housing areas surrounding Smithfield
The sounds of children and teenagers were absent, even with the vast housing areas that surround Smithfield Square—some dating back to the 1940s. Within five minutes of the square are two primary schools and one all-boy’s secondary school. During the day, I would hear the children playing in the school grounds, and in flat complexes close to the Smithfield Square. Each of these spaces were gated and enclosed. Most of the teenage participants lived within such housing areas, and would often refer to the level of noise made by the children within their immediate housing areas. Yet, none of the teenagers, and no young children, used the Smithfield Square for “hanging out” or playing.

A primary school in Smithfield. The play area is on the school roof
The teenagers argued that the Smithfield Square had no point; it was too wide open and too quiet.
Group 11b: Although, there probably was sound for somebody who listened to it but because we were all coming down from the city, the space seemed to be nothing… it just seemed real quiet, empty.
Because of that, the teenagers felt they could not group together to chat. For them, it would be like situating themselves in the middle of a stage. Their sounds were amplified or reverberated, ironically creating a feeling of being surveilled. They felt more comfortable and safer in confined areas, such as street corners, laneways, and the archways of large buildings. Within these smaller spaces, the sounds produced have closer reflections. Teenagers often surround themselves with sounds by shouting, playing music, etc., creating what Barry Blesser and Linda-Ruth Salter in Spaces Speak, Are You Listening? (2009) call a sonic bubble. These “territorial bubbles appear as if by magic around a group of individuals if they begin to interact, and the group quickly acquires rights to the arena” (2009:34) thus creating a temporal space. They did not feel they could do so in such an open area.
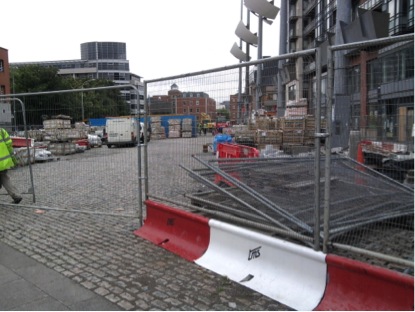
Smithfield Square by the summer of 2010

The Smithfield Square in 2011
Because of the poor planning and design of the Smithfield area, there are vast empty spaces surrounded by fencing or construction hoarding, numerous derelict buildings, and closed-down shops and restaurants. The Smithfield Square is no different, with numerous buildings left empty as a result of foreclosures or bankruptcy. The silence in this space is indicative of the loss of the social and economic processes. The vast square then takes on another level of silence, the loss of productive meaning, the presence of poverty, homelessness and unemployment.
On one walk with the teenagers I noted that they would group together in the square, even when they were told to walk around and record sounds within the space independently. Later, they said there were no sounds to record, so they just walked towards the closest sound source, a small shopping market in the square. I had noted numerous individual sounds, but they would have required standing in the middle of the square to record them. During focus group sessions after the soundwalks, the teenagers defined positive soundscapes as places with numerous loud sounds, the voices of hundreds within busy shopping streets, music coming from stores and traffic in the distance. These sounds defined a city, and made the teenagers feel safe and enclosed. Smithfield contained none of these kinds of sounds.
Soundwalking the Smithfield Horse Fair

Displaying horse carriages
There are a few events held regularly within the square since it re-opened in 2013. Some of these events are part of the Dublin City Council’s efforts to invigorate the space, such as food and art markets, as well as fairs for various seasons and holidays. One of the few public events that take place in Smithfield Square is the Smithfield Horse Fair, which happens on the first Sunday of every month. Having walked through this space repeatedly over a period of 3 years, it was only when I attended the horse fair that the space came alive, it had a purpose.
The horse fair has been a contentious event for both locals and city managers for the past two decades, with the horse dealers arguing that there is either a historical precedence for the horse fair or with the Dublin city councillors arguing that the land was historically used for the selling of cattle for market. The appearance within the Smithfield Square once a month of the horse fair brings with it a vast and lively, and sometimes, as defined by the media and Dublin City Council, a threatening soundscape/environment.
Some sounds defined as threatening are the loud whinnying of horses as they are jostled around the fair. The media has also reported, on several occasions, large-scale fights, which have broken out during the fair, leading to the presence of riot police. This eventually led to the gating of the fair and an extreme police presence as if these measures might reduce such sounds through the threat of arrest. For those living in the new apartment complexes, the sounds produced at the fair are amplified because of the design of the space, and possibly sound more threatening as a result.
During one walk of the Smithfield horse fair that I did in April 2013, some of the audible sounds were horses neighing and whinnying in panic, horse shoes on the cobblestones, traders shouting out their wares of horse paraphernalia, seats, stirrups etc., the voices of old men, which was the dominant background sound, and the sounds of traditional Irish music.
Outside of the gated fair were the sounds of large groups of teenagers, shouting and calling to each other. The space was alive with sound; the voices of teenagers merged with, or were lost within, the chaos of other sounds, becoming part of a larger soundscape. Because the space was busy with people, activities, music and even security there was a reason to use the square, even if you were not actively taking part in the event. The fair created a space for teenagers to engage with, and perhaps feel safe within the boundaries of its soundscape. Suddenly the square was as busy and as loud as the city centre.

Security at the horse fair
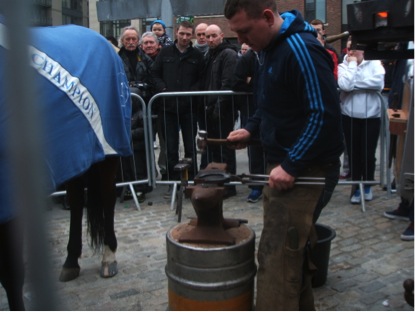
Smith hammering horse shoes at the horse fair
While walking through this soundscape, I encountered different kinds of soundmarks. For example, the banging of horseshoes was quite distinctive because it is, as Schafer would define, an archetypal sound, one that no longer belongs in the city. It felt like hearing a sound from the past. Yet this kind of sound creates a kind of historic continuity with the past (Barry Truax, Acoustic Communication, 2000). When discussing the cobblestones within Smithfield Square, most of the young female participants stated that it was not so much the look of the cobblestones that gave the space a sense of history but rather the sounds made when something moved over them. The lack of people and activities within the square meant that these sounds were rarely activated. The soundscape of the fair on those days transformed Smithfield, lifting it out of its everyday silences, which seemed to invite young people to participate. It was reactivated with life.
What was noticeable about the two fairs I visited was that by the second event in 2013, there were far fewer horses than at previous fairs. There were about 8 or 10 horses being paraded around the space by what looked like homeless people or addicts. There seemed to be no real horse-trading; the soundscape lacked the sounds of horses. Instead, the space had become a gathering space, with groups of tourists wandering around taking pictures of anything and everything.

Teenage boys outside the gates of the horse fair 2013

Teenage girls at the fair
Conclusion
This fair does not fit within the cultural ethos of regenerated urban spaces like Smithfield, where culture is defined as a consumerist process or part of the arts. However, the space takes on new potentialities as a result of the presence of people, sounds and activities, allowing the teenagers to view the possibilities of spatial use. Sounds can distinguish a space, as identified during the Smithfield horse fair. These sounds also remove focus from teenagers’ voices audible within the space, and transfer it to other sounds. The space was no longer a large fishbowl viewable from any angle; instead it had become a busy vibrant immersive soundscape.
—
Featured Image: “Smithfield Horse Fair, Dublin” by Flickr user Admanchester, CC BY-NC-ND 2.0
—
Linda O Keeffe is secretary to the Irish Sound Science and Technology Association and editor of the Interference Journal. Her practice is concerned with an exploration, both academic and creative, of the ways in which sound alters our experience of different spaces. Her art training was within the sculpture department of IADT under the tutelage of Finola Jones. She completed a Masters in Virtual Reality in NCAD with Kevin Atherton, and just finished a PhD in sociology in NUIM. Her research examined the urban of Dublin city soundscape as socially and technologically co-constructed. She has composed for dance, theatre, quartets, and new instrument performers, installed sound installations for commissions in Ireland, China and Holland, and has had radio works performed both nationally and internationally. In 2008 she was mentored under Eric Leonardson in Chicago, a sound artist and performer. More recently, she was commissioned by Resonance FM to create a work for radio for the 2013 Derry city of culture event. Current projects include a solo exhibition in November 2014 for the Limerick Sculpture Centre, which will be a creative realization of her PhD research. You can find her at www.lindaokeeffe.com.
—
 REWIND!…If you liked this post, you may also dig:
“Heard Any Good Games Lately?: Listening to the Sportscape”-Kaj Ahlsved
“Park Sounds: A Kansas City Soundwalk for Fall”-Liana Silva-Ford
“Sounding Out! Podcast Episode #7: Celebrate World Listening Day with the World Listening Project”
Share this:

The Noisiest City on Earth? or, What Can the 2012 Manhattan Noise Complaint Maps Really Tell Us?

“It’s a city, not a cemetery. You can’t tell everybody to go around wearing earplugs.”
Ex-New York City Parks Commissioner Henry J. Stern, quoted in “Many Pleas for Quiet, but City Still Thunders”
In 1905, a New York Times article declared New York City “the noisiest city on Earth.” More than a century later—this summer, to be exact—The New York Times ran a series on noise in New York City titled “What? The Long War on Loud” that proved that this city is still trying to figure out its relationship to sound. (One of the gems of that series? “New York’s War on Noise” timeline.) As a displaced New Yorker, some of my most vivid memories of the city are aural. Although New York City isn’t the only loud city out there, there are many reasons it’s called “The City That Never Sleeps”—and sound has a lot to do with it, depending on which neighborhood you call home.
Now you can see what neighborhoods are allegedly noisiest, and where all that noise comes from. Brooklyn designer Karl Sluis created the 2012 Manhattan Noise Complaints maps (click for full image), in which Sluis correlated the data on 311 noise complaints made during the year 2012 (40, 412 complaints, to be exact) that he obtained from the NYC Open Source site with Manhattan’s geographical coordinates. He used circles of various sizes to a) create an aural tracing of the island of Manhattan, sitting in a sea of turquoise blue b) showcase the number of complaints in an area. The bigger the circle, the larger the number of complaints.

Screen Capture of Karl Sluis’s 2012 Manhattan Noise Complaints maps (click for interactive image)
The maps Sluis has created are helpful for visualizing the complaints on a broad scale, but they paint an incomplete picture of what noise means in New York City. The demographics of each neighborhood are absent from each map, a slight that can perhaps be traced to the 311 data available, but in order to better understand how New Yorkers define “noise” those stats must be included. Both Sluis and John Metcalfe from The Atlantic Cities discuss notable findings, but neither takes into account the fact that some of the areas with a higher concentration of noise complaints are not just densely populated but densely populated with racial and ethnic minorities. Indeed, comparing the maps’ noisy hotspots to a map of Manhattan racial demographics reveal how urban racial dynamics intersect with ideas about sound and power: who can make sound, who must be chastised for making noise, who can complain and whose complaints are actually being heard.

“Unnecessary noise prohibited” by Flickr user Ricky Leong, CC BY-NC-SA 2.0
Mapping noise complaints gives a spatial dimension to noise, and it renders noise palpable, in a way. Sluis points out, “Noise complaints reveal the concentration of activity in the city as well as many smaller stories, such as the construction of the Second Avenue subway line, idling buses on the Upper East Side, and the homes of the loudest dogs (or the least patient neighbors).” He reminds us that the data comes from complaints and not necessarily decibels; in other words, it represents local ideas of what counts as sound and what counts as noise.
While Metcalfe correctly describes the thousands of 311 complaints about noise from 2012 as “the entire year’s expression of mass annoyance,” Sluis’s map does not go far enough toward figuring out whose annoyance, exactly. We must remember that annoyance oftentimes stems not just from physical reactions to noise but rather one’s perceptions about noise, what Jennifer Stoever-Ackerman deems “the listening ear.” How we hear others, Stoever-Ackerman argues, is not as natural as it seems. For example, whom we deem as noisy may stem from our community, our parents, and/or social conditioning. Accounting for race/ethnicity in noise maps will show how the listening ear conditions neighbors to categorize and react to certain sounds.
For the purpose of this analytic exercise, I compared Sluis’s maps and the Center for Urban Research, CUNY Graduate Center’s 2010 map of block-by-block demographic changes in New York City, in order to illustrate how population density and racial/ethnic demographics play a role in concentrated pockets of noise complaints. Drawn from 2010 census data, the CUNY map clearly delineates neighborhoods and color-codes the groups in each neighborhood per block: blue for whites, green for Latino, orange for black, purple for Asian, and grey for “Other.” Although the Center for Urban Research, CUNY Graduate Center’s maps cannot be superimposed on Sluis’s maps, they help give a general idea as to where neighborhoods are located in addition to racial demographics.

Manhattan below 110th Street in 2010, courtesy of the Center for Urban Research, CUNY Graduate Center

Manhattan above 110th Street 2010. Courtesy of the Center for Urban Research, CUNY Graduate Center
From the maps illustrating changing race/ethnicity patterns, I gathered what neighborhoods were predominantly white (West Village, Lincoln Square, Yorkville, Upper West Side), predominantly Latino (Washington Heights, East Harlem) predominantly black (Central Harlem, parts of Hamilton Heights), and predominantly Asian (Chinatown, blocks of the Lower East Side). When one compares Sluis’s overall noise map of Manhattan to the racial demographic maps of Manhattan, what stands out is that the major circles of noise complaints are also places where there are different racial and ethnic groups mingling (for example, Times Square) or places that are populated by mostly minorities (Hamilton Heights). Whereas Sluis flattens out the noise complaints, demographic stats point to the racial/ethnic contours of each neighborhood. Sluis’s maps focus on number of complaints; unfortunately this assumes everyone complaining is the same and that everyone making the noise is the same—a level aural playing field if you will. Bringing demographics into the equation underscores how not all complainers are equal and how not all complaints carry the same heft.
The city may be noisy, but “noisy” is relative. Sluis’s map shows some predictably noisy areas for those of us familiar with Manhattan’s soundscape (Union Square, Times Square) but it also draws attention to other areas not as predictable in the mainstream imagination (East Harlem South, Hamilton Heights). However, the maps by the Center for Urban Research, CUNY Graduate Center help us better understand the context for the high or low number of complaints in certain areas. For example, one of the biggest circles on Sluis’s general map of Manhattan is located in the Hamilton Heights/Washington Heights area; the Center for Urban Research, CUNY Graduate Center’s map of Manhattan above 110th Street show that these areas are densely populated by blacks and Latinos/as. This is key information because it reminds viewers that this neighborhood is a lot more ethnically diverse than other neighborhoods with a smaller number of complaints. It brings to mind: what role does race play in these complaints, in terms of those who complain and those who are the focus of the complaints? Although more people might mean more complaints, the prevalence of complaints like “loud talk” in East Harlem (Spanish Harlem) are nevertheless connected racialized ideas about people of color being “loud.” This doesn’t assume that the people complaining are white, but that they are complaining about groups that are characterized as loud, noisy, rowdy.

“Classic New York: noise, smoke” by Flickr user Will, CC BY-NC-ND 2.0
These noise maps, when put into conversation with demographic data, also indicate what areas are priorities in urban planning—the sounds of gentrification. The visualizations of the complaints by section (under the main map), combined with CUNY’s maps, are even more telling because they break down the number of complaints by category. The aforementioned northern tip of Manhattan, for example, is also where many of the complaints are concentrated. At a glance, loud parties, loud people, and loud car stereos seem to be the major complaints in those areas, according to Sluis’s visualizations. Meanwhile, noises of “urban growth,” such as construction and jackhammers, are less prevalent in these areas, whereas they are more prevalent below Central Park North, in now mostly-white neighborhoods.
Sluis’s maps of the 311 noise complaints data allow readers to see differences in terms of neighborhoods: who complains the most? what do they complain about? However, one thing to keep in mind is that first question: who makes the complaints. This is where the data falls short. Can it be assumed that those who are calling about the noise are mostly people who live in the neighborhood? Are Upper Manhattan neighbors less or more tolerant of noise? The answers to these questions, although they’re not found in Sluis’s map, point to how ideas of who is noisy or who can make noise are at play here.
I do not mean to downplay the usefulness of Sluis’s map. I instead call for the necessary addition of key missing factors to future noise maps in order to give us a more complex picture of noise complaints in Manhattan and elsewhere. Although it may not be possible to gather who the 311 callers are, including factors such as race and class may lead to very different noise maps. For example, what would a noise map of Manhattan look like if researchers brought income into the equation? Income inequality, especially in Manhattan where that imbalance is starkly on display, matters for the purpose of sound mapping. The more affluent neighborhoods are also the ones with less complaints and are the ones that are mostly inhabited by whites. Wealthier communities are more spread out and have more ability to couch themselves from noise, not to mention that it probably takes fewer complaints to get a response.

“Marcus Garvey Park Drum Circle, Harlem, NYC” by Flickr user j-No, CC BY-NC-ND 2.0
Gentrification is another factor: what kind of analysis could we do if we considered what neighborhoods have been gentrified in the past ten years? It is possible that as whites move into neighborhoods where people of color have historically lived, suddenly they find them noisy—hence, complaints. It is fitting to consider, for example, the tension between an established group of drummers in Marcus Garvey Park in Harlem and the inhabitants of a new highrise (characterized as “young white professionals”) who wanted the 30-years and running drum circle shut down, as reported in The New York Times in 2008. Moreover, if we accounted for the history of zoning in the neighborhoods that have the most or the least complaints it would add another layer of analysis to the data. Are some of these neighborhoods used as entertainment zones, for example? Is it easier to open up bars there than elsewhere in the city?
With these questions in mind, the maps go from beautiful renditions of data, to opening up a bigger conversation about the arbitrariness of noise. The demographical and sociological context of these noise complaints must accompany the raw data, especially when it comes to sound. The analysis also points to the source of the data: 311 calls. I wonder if this is the only way that people in Manhattan (and New York City at large) are dealing with noise. I’m sure that after a century of being “the noisiest city on Earth,” folks have gotten creative about it.
—
Featured image: ” Stranger 10/100 Johano” by Flickr user MichaelTapp, CC BY-ND 2.0
—
Liana M. Silva-Ford is co-founder and Managing Editor of Sounding Out! She is also known professionally as the Writer Whisperer.
—
 REWIND! . . .If you liked this post, you may also dig:
“I’m on my New York s**t”: Jean Grae’s Sonic Claims on the City -Liana Silva
The Noise You Make Should Be Your Own–Scott Poulson-Bryant
Sounding Out! Podcast Mini-Series (#16): Listening to The Tuned City of Brussels, Day 1: “Noise”
Share this:


Current Top Posts


April 2021
January 2020

November 2019

October 2019

August 2019

April 2014

November 2017
March 2015

December 2017

October 2015

Recent Comments